


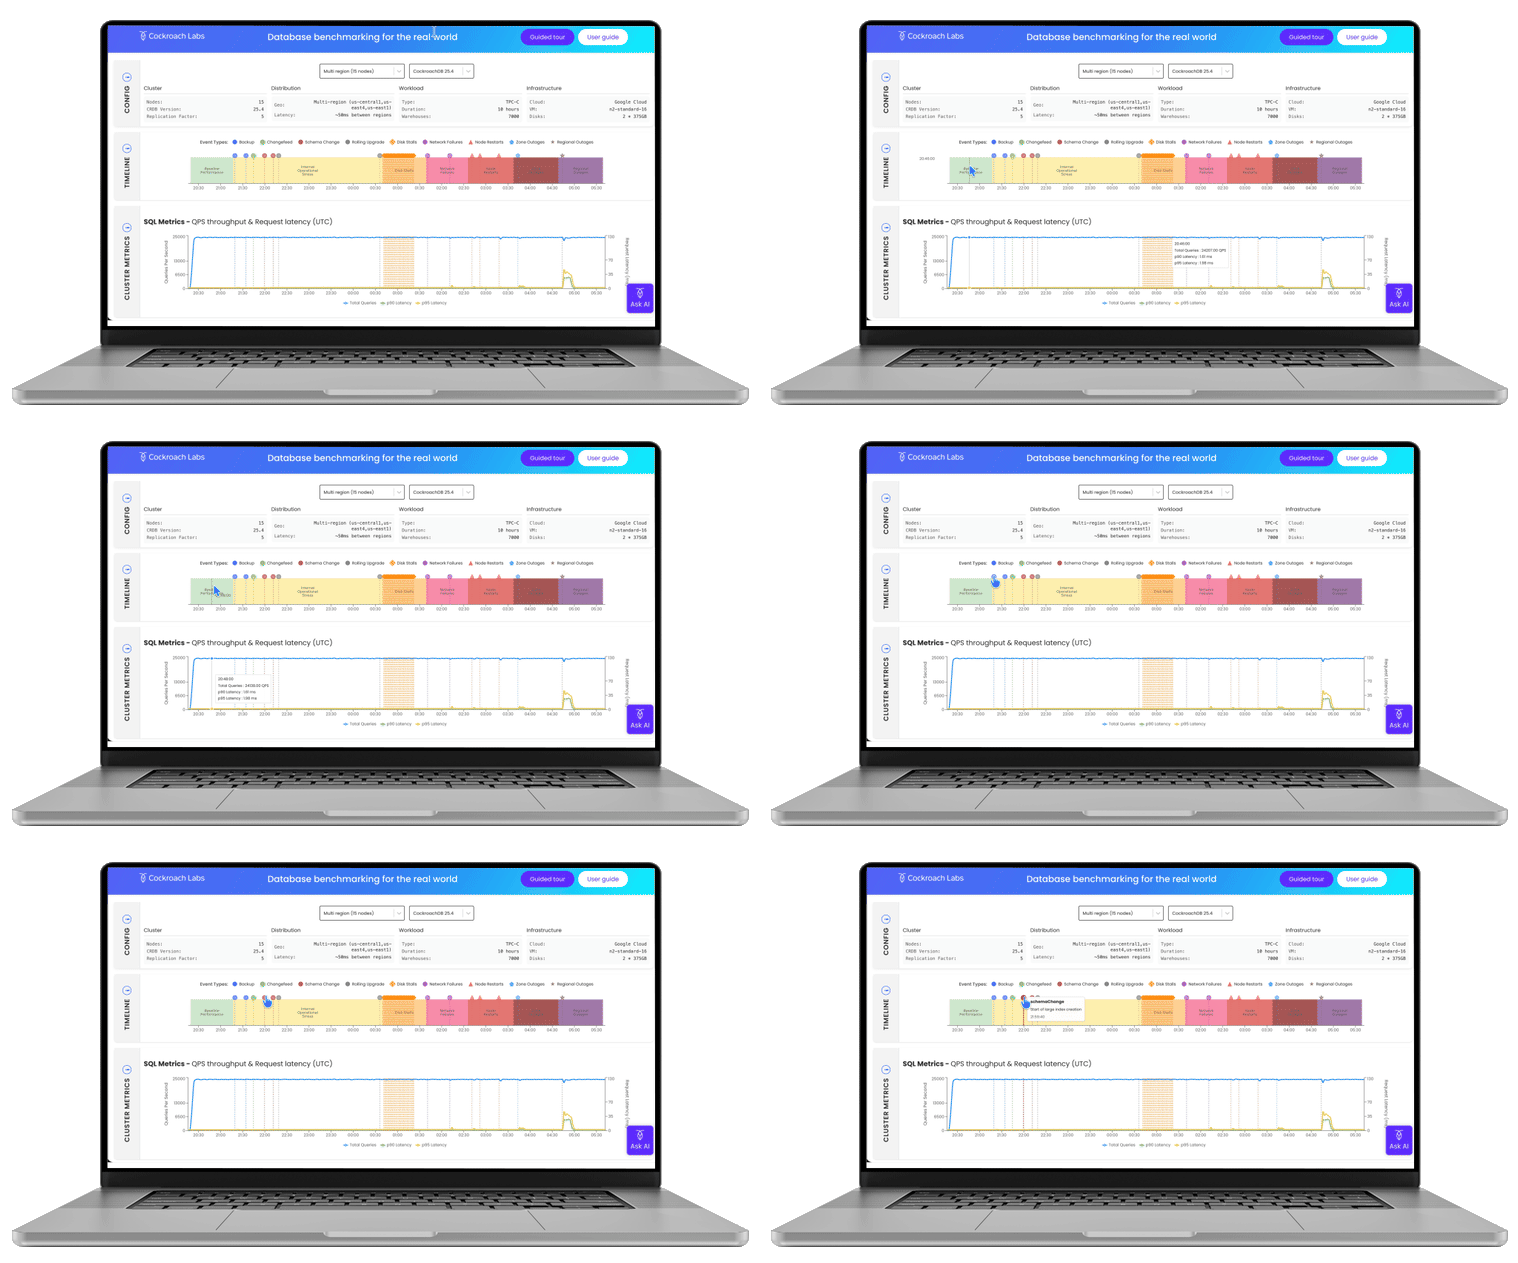
Traditional benchmarks miss the moments that matter.
Most performance tests show how databases behave in perfect conditions, but the real world isn’t perfect. Failures happen where zones go offline, networks get flaky, and upgrades introduce risk.
That's why we built the Performance under Adversity benchmark: to measure how CockroachDB performs when things break. We run a workload derived from TPC-C and keep it running through upgrades, disk stalls, network partitions, node restarts, and zone and region outages. The dashboard shows throughput, latency and each node's CPU, memory and disk activity, every two minutes, phase by phase.
This is what resilience looks like. This is what modern benchmarking demands.
Benchmarking for the Real-World
Click on the tooltips to explore how CockroachDB performed during real-world failure scenarios such as region outages, node restarts, disk stalls, all while maintaining consistent performance.

Benchmarked for:
1. Baseline Performance
Measure steady-state throughput under normal conditions.
2. Internal Operational Stress
Simulate database-intensive operations such as CDC, full backups, schema changes, and rolling upgrades.
3. Disk Stalls
Randomly inject I/O freezes to evaluate storage resilience.
4. Network Failures
Simulate node-to-node network partitions.
5. Node Restarts
Unpredictably reboot database nodes (1 at a time) to test recovery time.
6. Zone Outages
Take down all nodes in an availability zone (AZ).
7. Regional Outages
Take down all nodes in a region.

Inside the User Guide
Understand latency and throughput metrics
Recovery analysis for each failure type
Benchmark methodology breakdown
Global enterprises trust CockroachDB Cloud
 +
 +
 +

 +



How we run it.
The configurations and fault scripts behind these runs are public in the CockroachDB repository. They depend on our internal test tooling and cloud accounts, so you can read them but can't run them as they are.
See the configurations on GitHub
The Performance under Adversity workload is derived from the TPC-C benchmark and is not comparable to published TPC-C benchmark results, as this implementation does not comply with all the requirements of the TPC-C benchmark. How it differs from the TPC-C specification:
Not every loaded warehouse is active. In the multi-region runs, 7,000 of the 10,000 loaded warehouses receive transactions.
In the multi-region runs, every transaction uses local warehouses only. The specification requires 1% of New-Order items to come from a remote warehouse and 15% of Payment transactions to be for a customer of a remote warehouse.
Delivery transactions run interactively, not in deferred mode through a queue.
The workload keeps running when transactions fail. Only successful New-Order transactions are counted as throughput.
Faults and operations (backup, changefeed, index creation, rolling upgrade, disk stalls, network partitions, and node, zone and region outages) are injected while results are measured, so there is no steady-state measurement interval.
Throughput is reported as new orders per minute over short intervals, not as a tpmC figure for a measurement interval.
The response-time limits for each transaction type are not checked or enforced, and only New-Order latency is reported.
cockroach workload sends SQL directly in place of a remote terminal emulator. There is no terminal emulation, and response times are measured at the workload client.
No ACID or durability tests are run, and the initial data load skips consistency checks.
The 60-day space requirement is not calculated or checked.
There is no priced configuration and no price/performance figure.
There is no Full Disclosure Report or Executive Summary.
The results have not been reviewed by a TPC auditor.
Results come from the configurations named on the dashboard and will differ on other hardware and workloads