

This feature is in and subject to change. To share feedback and/or issues, contact Support.
SHOW VIRTUAL CLUSTER... WITH REPLICATION STATUSin the SQL shell.- The Physical Replication dashboard on the DB Console.
- Prometheus and Alertmanager to track and alert on replication metrics.
SQL shell
In the standby cluster’s SQL shell, you can querySHOW VIRTUAL CLUSTER... WITH REPLICATION STATUS for detail on status and timestamps for planning :
Responses
Data state
DB Console
You can access the for your standby cluster athttps://{your IP or hostname}:8080/. Select the Metrics page from the left-hand navigation bar, and then select Physical Cluster Replication from the Dashboard dropdown. The user that accesses the DB Console must have admin privileges to view this dashboard.
Use the Graph menu to display metrics for your entire cluster or for a specific node.
To the right of the Graph and Dashboard menus, a time interval selector allows you to filter the view for a predefined or custom time interval. Use the navigation buttons to move to the previous, next, or current time interval. When you select a time interval, the same interval is selected in the pages. However, if you select 10 or 30 minutes, the interval defaults to 1 hour in SQL Activity pages.
Hovering your mouse pointer over the graph title will display a tooltip with a description and the used to create the graph.
When hovering on graphs, crosshair lines will appear at your mouse pointer. The series’ values corresponding to the given time in the cross hairs are displayed in the legend under the graph. Hovering the mouse pointer on a given series displays the corresponding value near the mouse pointer and highlights the series line (graying out other series lines). Click anywhere within the graph to freeze the values in place. Click anywhere within the graph again to cause the values to change with your mouse movements once more.
In the legend, click on an individual series to isolate it on the graph. The other series will be hidden, while the hover will still work. Click the individual series again to make the other series visible. If there are many series, a scrollbar may appear on the right of the legend. This is to limit the size of the legend so that it does not get endlessly large, particularly on clusters with many nodes.
The Physical Cluster Replication dashboard tracks metrics related to physical cluster replication jobs. This is distinct from the , which tracks metrics related to how data is replicated across the cluster, e.g., range status, replicas per store, and replica quiescence.
Logical bytes
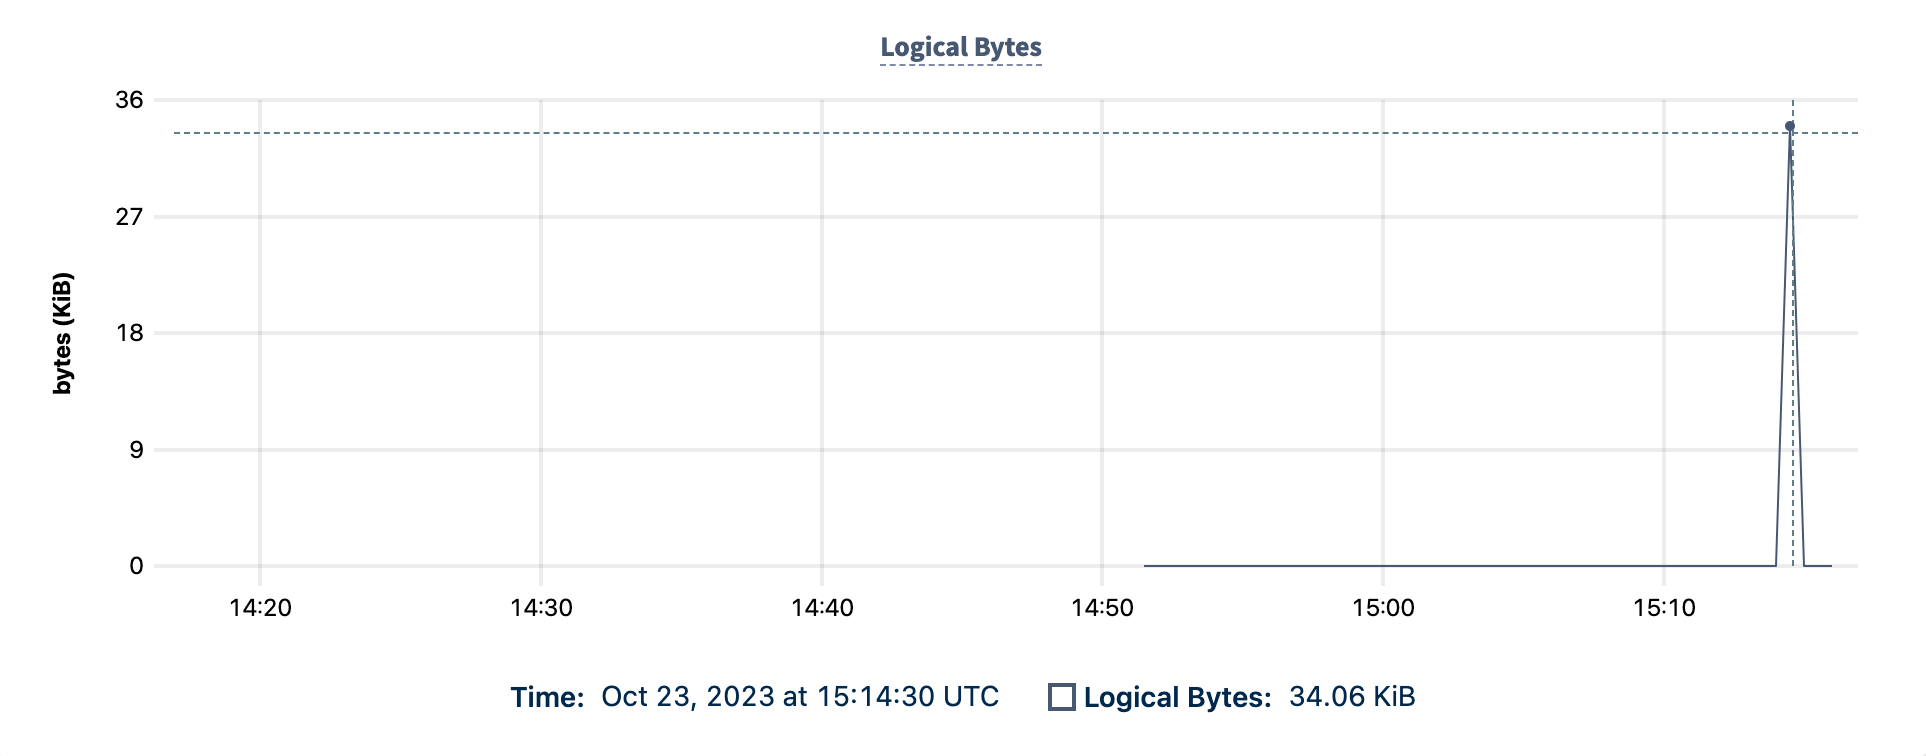
- The date and time.
- The number of logical bytes replicated in MiB.
When you , the Logical Bytes graph will record a spike of throughput as the initial scan completes.
SST bytes
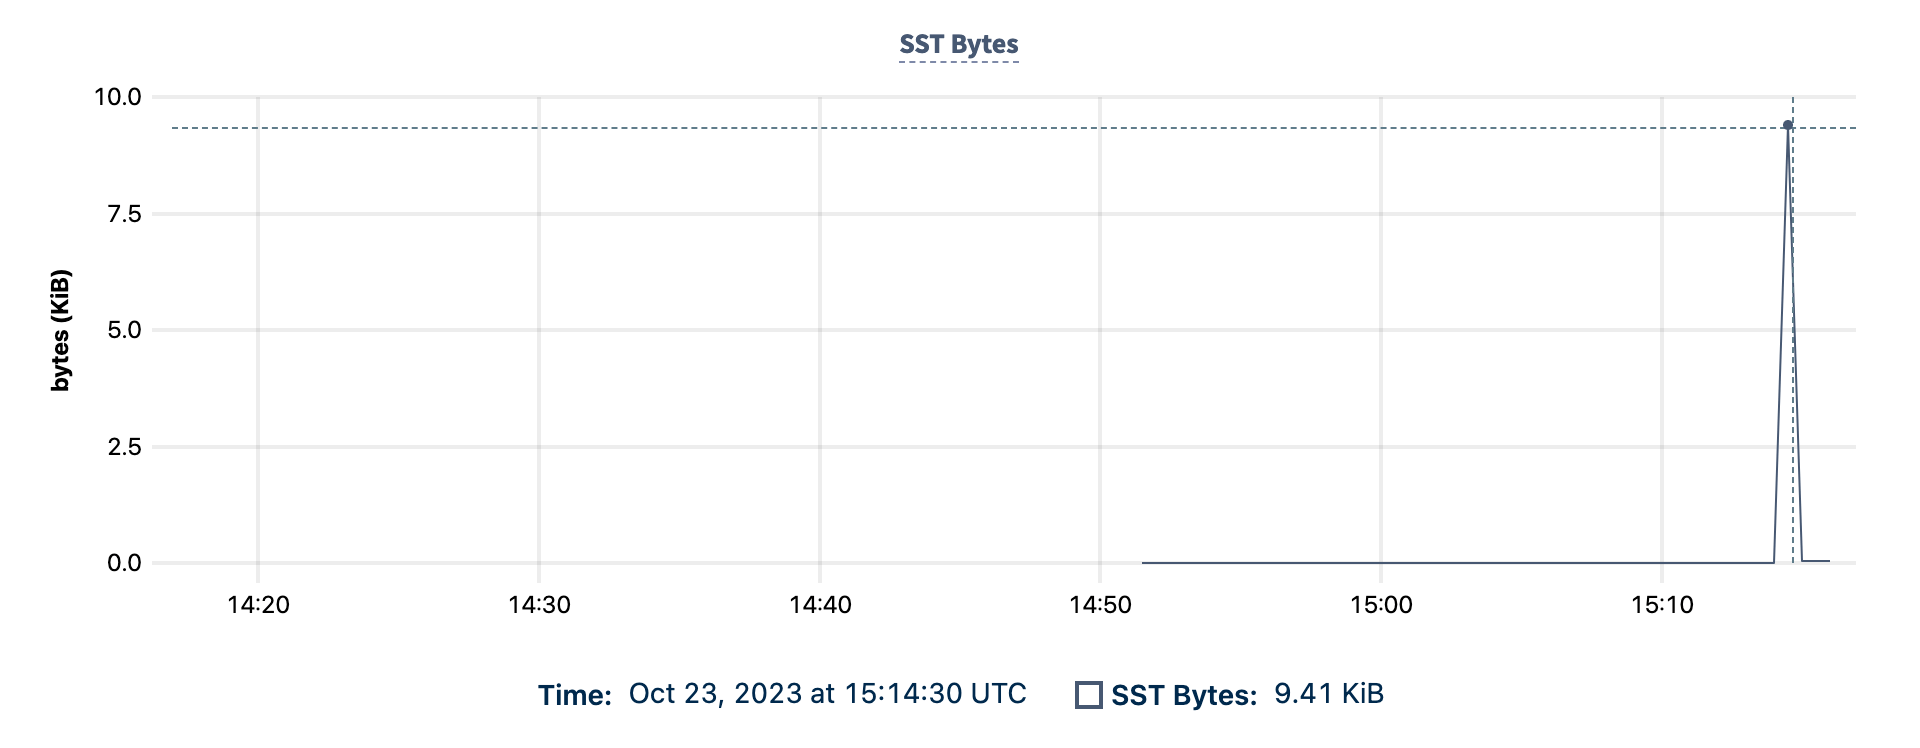
- The date and time.
- The number of SST bytes replicated in MiB.
Prometheus
You can use Prometheus and Alertmanager to track and alert on physical cluster replication metrics. Refer to the tutorial for steps to set up Prometheus. We recommend tracking the following metrics:physical_replication.logical_bytes: The logical bytes (the sum of all keys and values) ingested by all physical cluster replication jobs.physical_replication.sst_bytes: The bytes (compressed) sent to the KV layer by all physical cluster replication jobs.physical_replication.replicated_time_seconds: The of the physical replication stream in seconds since the Unix epoch.
Data verification
This feature is in and subject to change. To share feedback and/or issues, contact Support.
SHOW EXPERIMENTAL_FINGERPRINTS statement verifies that the data transmission and ingestion is working as expected while a replication stream is running. Any checksum mismatch likely represents corruption or a bug in CockroachDB. Should you encounter such a mismatch, contact Support.
To verify that the data at a certain point in time is correct on the standby cluster, you can use the from the replication job information to run a point-in-time fingerprint on both the primary and standby clusters. This will verify that the transmission and ingestion of the data on the standby cluster, at that point in time, is correct.
-
Retrieve the current replicated time of the replication job on the standby cluster with :
For detail on connecting to the standby cluster, refer to .
-
From the primary cluster’s system virtual cluster, specify a timestamp at or earlier than the current
replicated_timeto retrieve the fingerprint. This example uses the currentreplicated_time:For detail on connecting to the primary cluster, refer to . -
From the standby cluster’s system virtual cluster, specify the same timestamp used on the primary cluster to retrieve the standby cluster’s fingerprint:
- Compare the fingerprints of the primary and standby clusters to verify the data. The same value for the fingerprints indicates the data is correct.